DASHBOARD
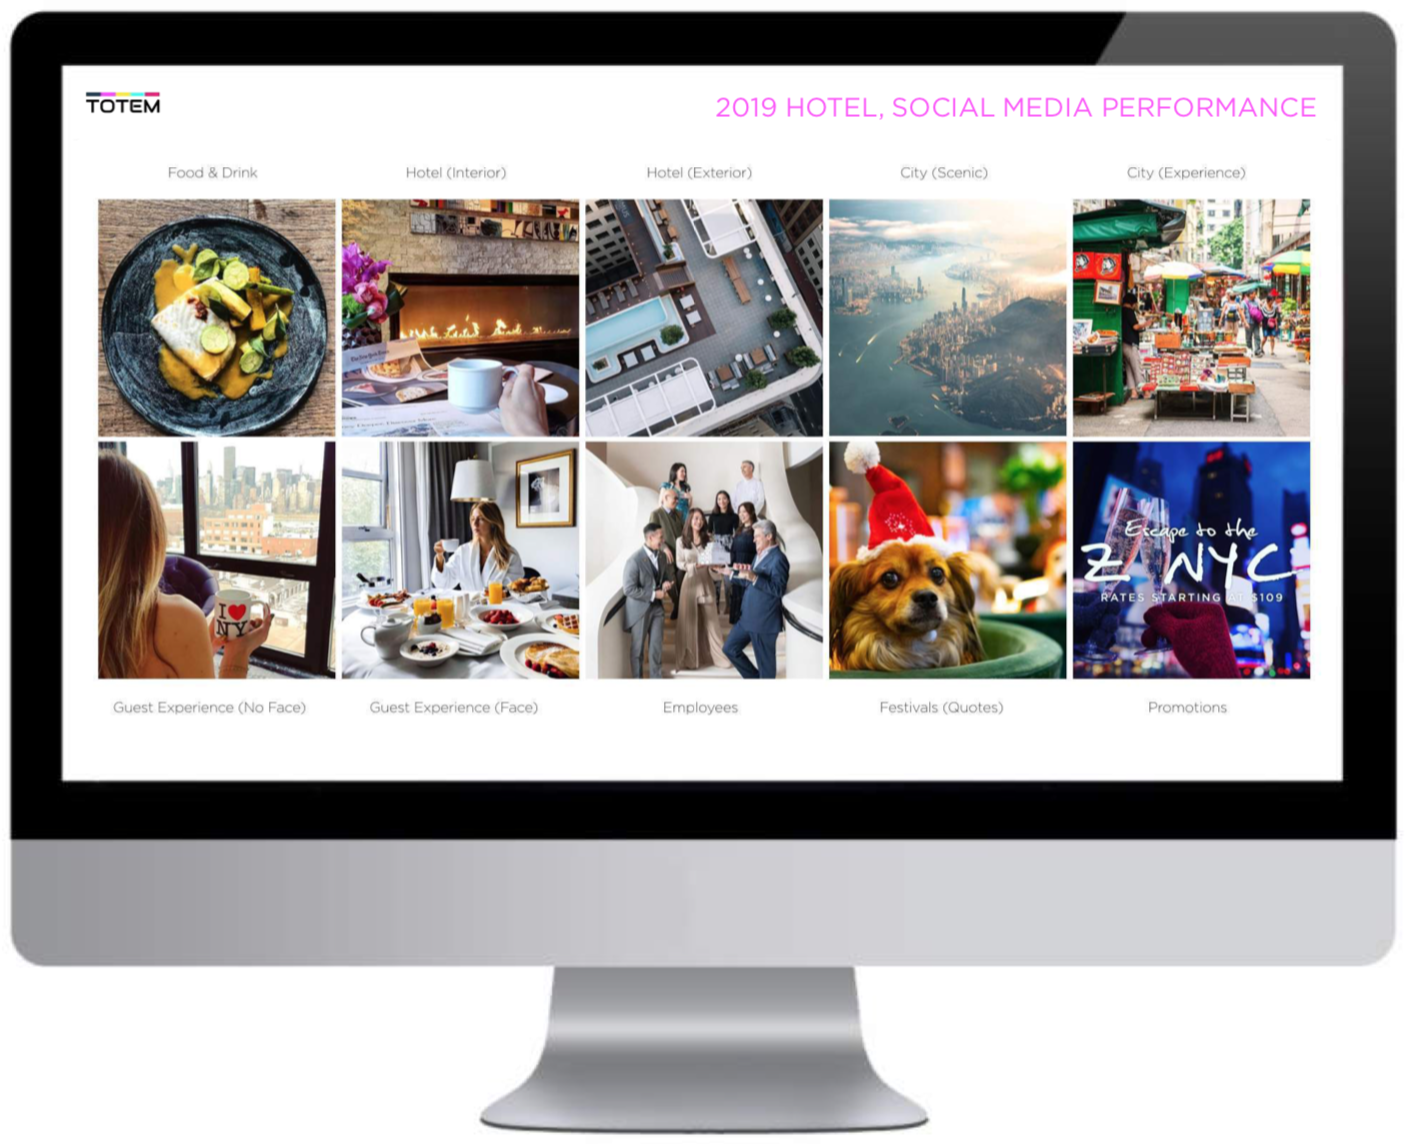
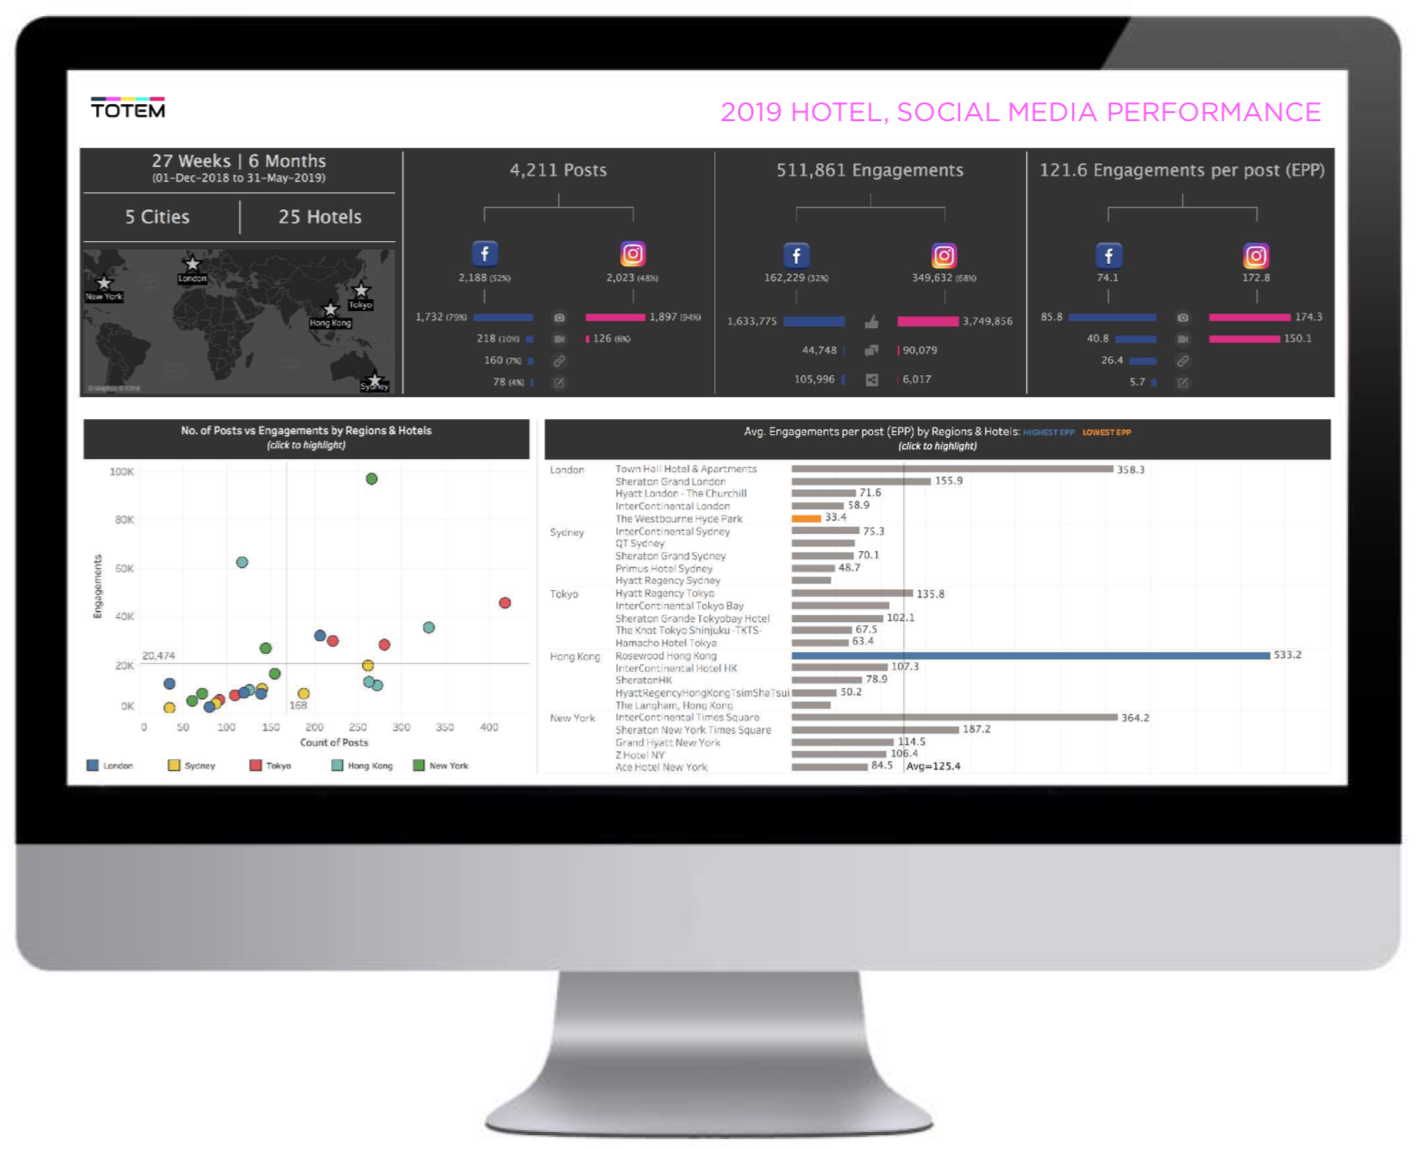
All of the data from the research was complied and visualized (featured here, using Tableau).
Visualizing data allows for depth and clarity on what’s really happening by channel (Facebook vs Instagram), by city, by hotel, by time, format, theme, style… etc.
The data has been analyzed to reveal a multitude of important insights covered in this report.
